There are a variety of tools for creating online maps, but many are impractical, requiring you either to enter numerous points by hand, to structure and import data in a specific format, to learn an expensive or cumbersome tool, or to be a programmer.
Geosheets makes it easier to create map visualizations and manipulate location data directly within Google Sheets, so if you are comfortable with spreadsheets, you can make rich, interactive maps quickly.
Here’s an example showing how to import data from a webpage and then map it, using just two function calls. To get started, either make a copy of the Geosheets demo template, or install the Geosheets add-on for Google Sheets.
Football season is in full swing, so we’re going to map the location of all NFL franchises in the US. Fortunately, there’s a table of all teams and the locations where they play at https://en.wikipedia.org/wiki/National_Football_League.
In cell A3 so that you have a little room to work, write this formula:
=IMPORTHTML(“https://en.wikipedia.org/wiki/National_Football_League”, “table”, 3)
IMPORTHTML is a built-in Google Sheets function that takes the url of a webpage that contains a table and automatically imports the table data into your sheet. The arguments are (1) a url to scrape, (2) whether to look for a “table” or a “list”, and (3) the item position on the page. Here we passed “table” and “3” because we want to import the 3rd table on that page.
Now that we have our data, we’re ready to map it. In cell A1 or wherever you have empty space, write this formula:
=GEO_MAP(A3:H37, “nfl-cities”, “City”)
And voila, in a moment the cell should populate with the url of your full-page, interactive map.
Here we call the GEO_MAP function from Geosheets, which takes a table of data from our spreadsheet and maps it. We pass the full range of our imported data including the header row, which is the range A3:H37. The second argument is a label for the map so it can be referred to later; this can be anything that you want, but we chose “nfl-cities” for this example. Lastly, we have to tell Geosheets which column contains the location we wish to map. If your location data is in the first column, you can omit this, but ours is in column C which is titled “City”, so we include that as our last argument. Geosheets then goes and geocodes each location, creates a map, and returns to you the url of that map. If you use the Geosheets add-on you’ll see an auto-updating preview of the map in a sidebar right within Google Sheets.
Your map should look something like this:

If you choose to, you can now get fancy, and add additional columns like “Color”, “Type”, “Radius”, and “Icon” to customize the map. View your full-page map to change settings, like the title or base map tiles.
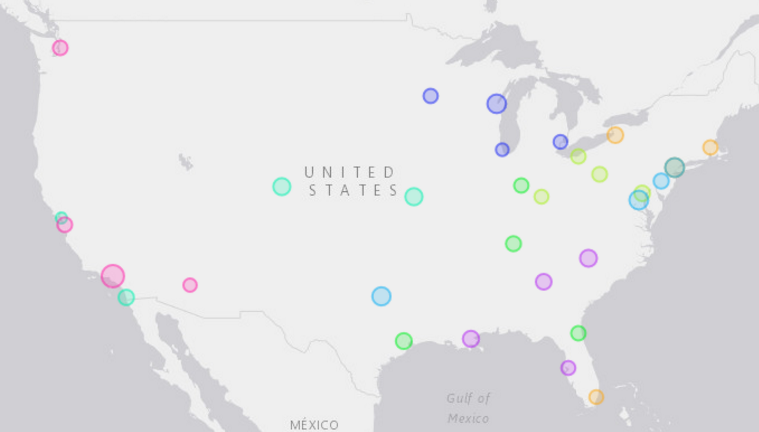
Here’s a customized map of the same data, where the larger radius represents higher-capacity stadiums, and the color-coding represents the division each team belongs to:
You can learn more about Geosheets at www.geosheets.com. More examples and tutorials are available at the Geosheets Blog, blog.geosheets.com, and full documentation can be found here.
Author: Jonathan Goldman