GIS user technology news

News, Business, AI, Technology, IOS, Android, Google, Mobile, GIS, Crypto Currency, Economics

  • Advertising & Sponsored Posts
    • Advertising & Sponsored Posts
    • Submit Press
  • PRESS
    • Submit PR
    • Top Press
    • Business
    • Software
    • Hardware
    • UAV News
    • Mobile Technology
  • FEATURES
    • Around the Web
    • Social Media Features
    • EXPERTS & Guests
    • Tips
    • Infographics
  • Blog
  • Events
  • Shop
  • Tradepubs
  • CAREERS
You are here: Home / * PRESS / Environment / NOAA Map Update – Are you dreaming of a white Christmas?

NOAA Map Update – Are you dreaming of a white Christmas?

December 11, 2015 By GISuser

Minnesota. Maine. Upstate New York. The Allegheny Mountains of Pennsylvania and West Virginia. Practically anywhere in Idaho. And of course, the Rockies or the Sierra Nevada Mountains. These are the places where weather history suggests you want to be if you’re looking for the best chance of a white Christmas.

NOAA Map Update - Are you dreaming of a white Christmas?

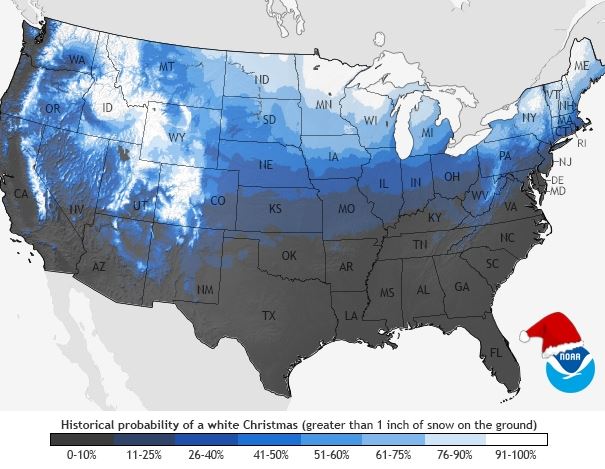
The map at right shows the historic probability of there being at least 1-inch of snow on the ground in the Lower 48 states on December 25 based on the latest (1981-2010) U.S. Climate Normals from NOAA’s National Climatic Data Center.  Dark gray shows places where the probability is less than 10 percent, while white shows probabilities greater than 90  percent.

The 1981–2010 Climate Normals are the latest three-decade averages of several climatological measurements. This dataset contains daily and monthly Normals of temperature, precipitation, snowfall, heating and cooling degree days, frost/freeze dates, and growing degree days calculated from observations at approximately 9,800 stations operated by NOAA’s National Weather Service.

While the map shows the climatological probability that a snow depth of at least one inch will be observed on December 25, the actual conditions this year may vary widely from these probabilities because the weather patterns present will determine the snow on the ground or snowfall on Christmas day. These probabilities are useful as a guide only to show where snow on the ground is more likely.  For prediction of your actual weather on Christmas Day, check out your local forecast at Weather.gov.

You can locate Normals data for the observing station closest to you using the NCDC’s interactive map.

If you would like to keep track of the snowfall across the United States on a daily basis, see the National Operational Hydrologic Remote Sensing Center’s National Snow Analyses.

This post was adapted from an article first published by the National Climatic Data Center. It was first published on December 11, 2013.

Filed Under: Environment, Maps and Cartography, Top Press Tagged With: NOAA, snow map

Editor’s Picks

Feature – Oil and Water: Mapping the South China Sea

Device Spotlight – Trimble R1 GNSS Receiver

Location Privacy and What you Might be Sharing Over Public WiFi

US Army Corps of Engineers Selects SimActive for Drones

See More Editor's Picks...

Recent Industry News

Aerial Surveys Int’l and Global Marketing Insights to Present GEOINT 2026 Workshop on Multi-Domain Geospatial Fusion for Automated Infrastructure Monitoring

April 24, 2026 By GISuser

Why Timing Matters More Than You Think With Spray Seal (And Why People Often Get It Slightly Wrong)

April 22, 2026 By GISuser

The Quiet Planning Stage Most People Don’t See When Building a Pool in Brisbane

April 22, 2026 By GISuser

Best Equipment Labels for Industrial Use: Ranked Systems That Survive Real-World Conditions

April 17, 2026 By GISuser

Hot News

State of Data Science Report – AI and Open Source at Work

HERE and AWS Collaborate on New HERE AI Mapping Solutions

Virtual Surveyor Adds Productivity Tools to Mid-Level Smart Drone Surveying Software Plan

Categories

Copyright gletham Communications 2015 - 2026

Go to mobile version