GIS user technology news

News, Business, AI, Technology, IOS, Android, Google, Mobile, GIS, Crypto Currency, Economics

  • Advertising & Sponsored Posts
    • Advertising & Sponsored Posts
    • Submit Press
  • PRESS
    • Submit PR
    • Top Press
    • Business
    • Software
    • Hardware
    • UAV News
    • Mobile Technology
  • FEATURES
    • Around the Web
    • Social Media Features
    • EXPERTS & Guests
    • Tips
    • Infographics
  • Blog
  • Events
  • Shop
  • Tradepubs
  • CAREERS
You are here: Home / *BLOG / Around the Web / Mapping the First Day of Snow

Mapping the First Day of Snow

October 29, 2015 By GISuser

An interesting effort from NOAA as they share a process for mapping the approximate first day of snow

Mapping the First Day of Snow

Mapping the First Day of Snow

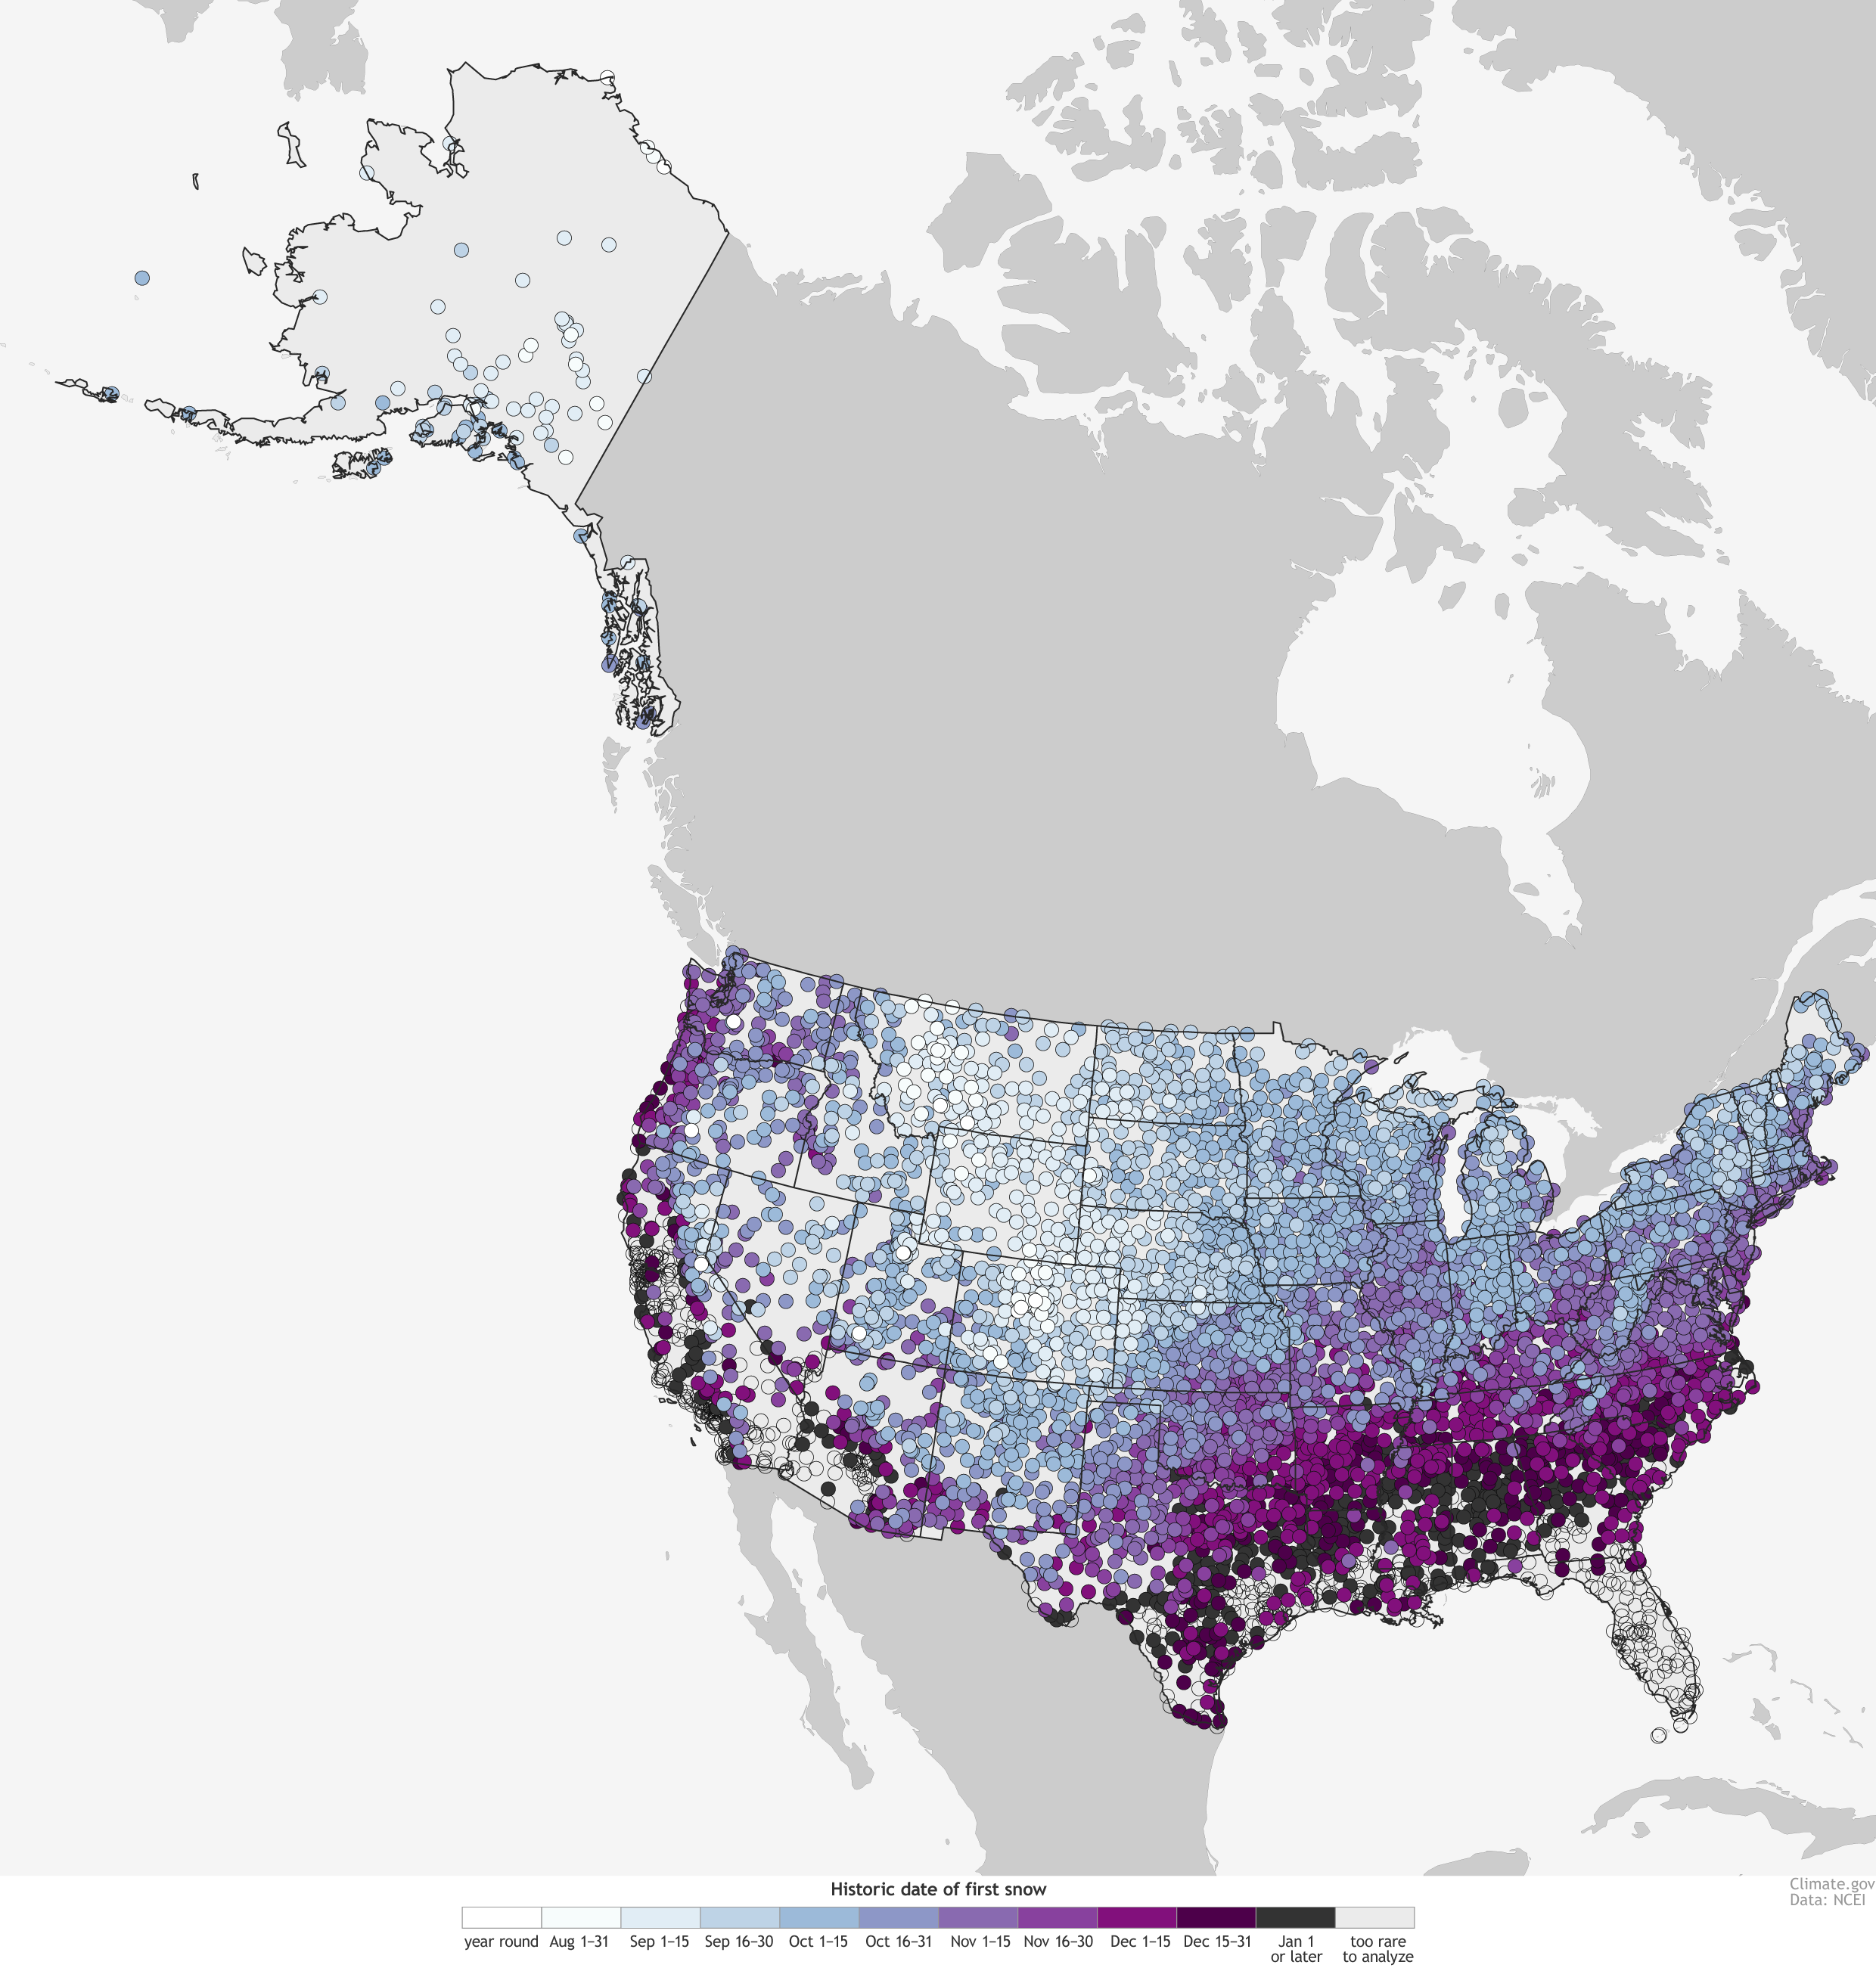
Colored dots indicate the date by which there’s a 50% chance at least 0.1” of snow will have accumulated, based on each location’s snowfall history from 1981-2010. Click the map for a larger version with more detailed categories. Map by NOAA Climate.gov, based on analysis of the US Climate Normals by Mike Squires, National Centers for Environmental Information. *Update: 10/27, 3:43 pm. We’ve released updated versions of these maps. The original versions were missing some locations in the “August or year-round risk” category. Also, Alaska has been added to the large version of the map.

A quick look at the map reveals the obvious: the main factors that govern the average day of your first snow are the same main factors that govern your other major climate characteristics: latitude and altitude. In general, the farther north you are, and the farther up you are, the earlier the threat of first snow. In fact, the highest elevation stations along the spines of the Rockies have a year-round threat of snow. On the other end of the spectrum, the Deep South, Gulf Coast, Desert Southwest and Hawaii have many stations that get snow so infrequently, there’s no date listed (empty circles). In these places, there just aren’t enough events to make robust statistics.

There are also a few interesting, but more subtle, regional features. Across the Plains and Midwest, instead of a straight-up east-west pattern, there’s a slight northeastward tilt, where earlier dates plunge farther southward in the plains, relative to the more Midwestern states. It’s especially noticeable along a line stretching roughly from the Texas panhandle to Chicago. This has a little bit to do with elevation, but more to do with the fact that the coldest air associated with many winter storms—including early winter storms—often barrel down the high plains, corralled by the Rockies to the west.

Read more from NOAA on this project HERE

Filed Under: Around the Web, Environment, Maps and Cartography Tagged With: map of the day, NOAA, snowfall map

Editor’s Picks

Learn to Make Decisions Using Lidar Data and Geographic Information Systems

Orbit GT supports LasZip for LAS 1.2 and LAS 1.4

50 startups from 17 countries to showcase their innovative Internet of Things approaches at CeBIT

2015’s Best & Worst Metro Areas for STEM Professionals

See More Editor's Picks...

Recent Industry News

Aerial Surveys Int’l and Global Marketing Insights to Present GEOINT 2026 Workshop on Multi-Domain Geospatial Fusion for Automated Infrastructure Monitoring

April 24, 2026 By GISuser

Why Timing Matters More Than You Think With Spray Seal (And Why People Often Get It Slightly Wrong)

April 22, 2026 By GISuser

The Quiet Planning Stage Most People Don’t See When Building a Pool in Brisbane

April 22, 2026 By GISuser

Best Equipment Labels for Industrial Use: Ranked Systems That Survive Real-World Conditions

April 17, 2026 By GISuser

Hot News

State of Data Science Report – AI and Open Source at Work

HERE and AWS Collaborate on New HERE AI Mapping Solutions

Virtual Surveyor Adds Productivity Tools to Mid-Level Smart Drone Surveying Software Plan

Categories

Copyright gletham Communications 2015 - 2026

Go to mobile version