
REDLANDS, Calif.–(BUSINESS WIRE)–Esri, the global leader in location intelligence, announced today that UnemploymentPulse, a new app built with ArcGIS Platform, lets you explore 14 months of unemployment data from the Bureau of Labor Statistics as spark lines in each state and county against the national average. Inspired by the COVIDPulse app, this mapping app lets you compare the […]
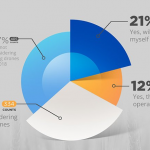
Infographic – The Jobs AI Will Take Over First

30% of jobs in Britain could be under threat from breakthroughs in artificial intelligence (AI). But which ones?
Emlid Reach RS2 – Multi-band RTK GNSS receiver
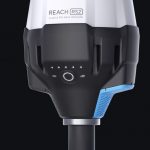
Emlid Reach RS2 – Multi-band RTK GNSS receiver for $1899 – Emlid, the creators of Reach, centimeter-accurate RTK GNSS receiver, launched pre-orders for their multi-band GNSS receiver Reach RS2. The new receiver features built-in LoRa radio, 3.5G modem and a survey app for iOS and Android.
Geo Fun! Population Bracketology from the US Census

Ok, you may have done up your #MArchMAdness bracket and perhaps it’s busted already, but don’t worry, you can fill out your Population Bracket at the US Census!
Infographic – Coding Bootcamp vs. Computer Science Degree

Investing in the training necessary to write code professionally, be that selecting a great bootcamp or picking the best online colleges could be among the most secure career decisions a person can make for their future. So what’s keeping driven, capable individuals from this lucrative and in-demand profession? This infographic explores the topic a bit deeper.
Infographic – How to turn big data into actionable intel

With big data, companies can closely study purchasing behavior, integrate campaigns, and set more relevant goals.
Infographic – Navigating Your Cloud Journey

A Step-by-Step Guide
A new infographic from Dronefly.com explains: How are drones being used for agriculture?
Dronefly.com has released its third infographic on drone use applications. This time they discuss one of the largest addressable commercial market segment: agriculture.
Animated Map Shows #MeToo Going Viral Within Hours
The #MeToo message spread like a wildfire across the globe, as shown in a dramatic new animation.
Dimension Data Releases Summary Of Data Analytics For The First Nine Stages Of Tour De France

Tour de France riders climbed 9,000 metres in the Pyrenees which is higher than Mount Everest