‘Polar vortex’ is the new buzzword of 2014 for the millions of Americans learning about its role in producing record cold temperatures across the country. Meteorologists have known for years that the pattern of the polar vortex determines how much cold air escapes from the Arctic and makes its way to the U.S. during the winter. Now climate scientists want to know if a warmer Arctic is influencing its behavior.
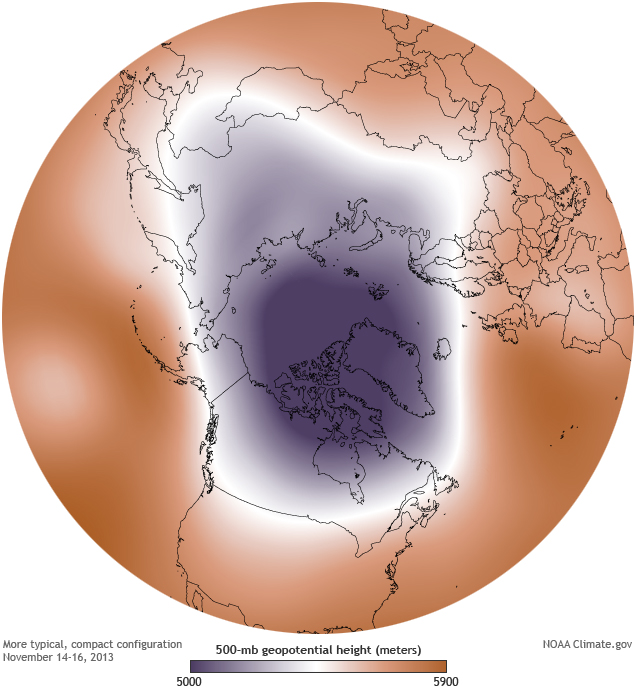
The polar vortex is a high altitude low-pressure system that hovers over the Arctic in winter. When the polar vortex is strong, it acts like a spinning bowl balanced on the top of the North Pole. The image on the right shows a strong phase of the polar vortex in mid-November 2013. Dark purple depicts the most frigid air tightly contained in an oval-shaped formation inside the invisible bowl. The light purple line forming the outermost boundary of the cold Arctic air is the jet stream in its normal west-to-east pattern.
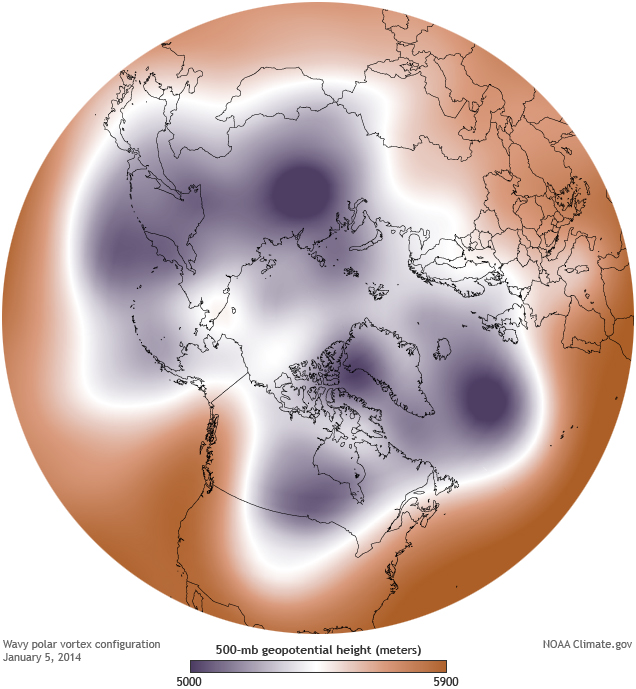
In early January, the polar vortex weakened and broke down*, allowing fragments of cold air to slosh out of the bowl into mid-latitudes. The image on the left shows the weakened vortex formation on January 5, 2014. The high pressure building up in the Arctic slowed down the jet stream, which caused it to buckle into deep folds and flow farther south than usual, introducing cold Arctic air into the central and eastern U.S.
In recent years, climate scientists have noticed that the jet stream has taken on a more wavy shape instead of the more typical oval around the North Pole, leading to outbreaks of colder weather down in the mid-latitudes and milder temperatures in the Arctic, a so-called “warm Arctic-cold continents” pattern. Whether this is normal randomness or related to the significant climate changes occurring in the Arctic is not entirely clear, especially when considering individual events. But less sea ice and snow cover in the Arctic and relatively warmer Arctic air temperatures at the end of autumn suggest a more wavy jet stream pattern and more variability between the straight and wavy pattern.
Understanding the connections between the Arctic warming trend and more severe weather in the mid-latitudes remains an active area of research. But even as Earth’s average temperature rises, natural patterns of climate variability are expected to still operate in a warmer world. There have been many other cases of natural climate oscillations influencing our winter weather in recent years. The unusually cold winter of 2009-2010 proved that record-breaking snowstorms can still coexist with global warming, as did the frigid start to 2011, which resulted in another wintry winter for the eastern United States.
*CORRECTION: This sentence originally attributed the breakdown of the polar vortex to a sudden stratospheric warming event, which did not actually develop.

Maps show the 500-millibar geopotential height (the altitude where the air pressure is 500 millibars) on January 5, 2014 (left), and in mid-November 2013 (right). The cold air of the polar vortex is purple. Maps by NOAA Climate.gov, based on NCEP Reanalysis data from NOAA ESRL Physical Sciences Division.
large images January 5 | mid-November 2013
Map by NOAA Climate.gov, based on NCEP/NCAR Reanalysis data. Reviewed by James Overland, NOAA PMEL.
Editor’s note: Please pardon the erroneous event locator icon on the map at upper right. Due to technical difficulties, the dot is showing up off West Africa. Please know that the Climate.gov communications team does, in fact, know where the North Pole is, and bear with us as our web techs troubleshoot the problem.
Related Links
NOAA Pacific Marine Environmental Laboratory (2014, January 6) What’s going on with the Polar Vortex?
Washington Post (2014, December 31) Sudden stratospheric warming: could it lead to a very cold January in D.C.?
Climate Central (2013, January 21) Stratospheric Phenomenon Is Bringing Frigid Cold to U.S.
NOAA (2011, February 28) Warm Arctic, Cold Continents