GIS user technology news

News, Business, AI, Technology, IOS, Android, Google, Mobile, GIS, Crypto Currency, Economics

  • Advertising & Sponsored Posts
    • Advertising & Sponsored Posts
    • Submit Press
  • PRESS
    • Submit PR
    • Top Press
    • Business
    • Software
    • Hardware
    • UAV News
    • Mobile Technology
  • FEATURES
    • Around the Web
    • Social Media Features
    • EXPERTS & Guests
    • Tips
    • Infographics
  • Blog
  • Events
  • Shop
  • Tradepubs
  • CAREERS
You are here: Home / * PRESS / Business / Ease Up or Lock Down? New App Shows COVID-19 Spikes and Trends in Your Community

Ease Up or Lock Down? New App Shows COVID-19 Spikes and Trends in Your Community

September 1, 2020 By GISuser

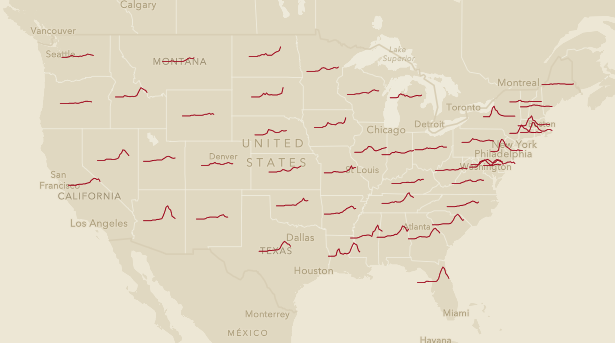
REDLANDS, Calif.—Esri, the global leader in location intelligence, announced today that it released a new app (https://livingatlas.arcgis.com/covidpulse) to help stakeholders and the public understand how COVID-19 is trending in every state and county in the US. The daily-updated app, which visualizes trend lines for new cases, deaths, as well as cumulative cases, tracks case data compiled by Johns Hopkins University from January 2020 to the present. At a glance, users can easily see where cases are spiking, declining, or holding steady.


Explore COVID trends in every US state and county with new @Esri COVID Pulse app

Tweet this
“This app empowers stakeholders and leaders to make scientific, data-driven decisions about what comes next for their community when it comes to COVID-19,” said Dr. Este Geraghty, Chief Medical Officer at Esri. “The ability to explore case data over time and compare one place to another is critical to understanding if communities should begin to reopen schools and businesses, continue with current restrictions, or ramp up mitigation efforts.”

You can also examine how past decisions have played out in terms of COVID cases. For example, Orange County, North Carolina, home to University of North Carolina at Chapel Hill, shows a clear spike as students returned to campus for in-person learning.

Dr. Geraghty has recorded a short, 3-minute video showcasing the app and how to use it here: https://www.youtube.com/watch?v=OyU17RKh3xs&feature=youtu.be

Filed Under: Business, Emergency Response, Top Text Lead Story Tagged With: covid, ESRI

Editor’s Picks

Using Lidar to Classify Landslides

MapAnything, Inc. Releases U.S. Property Data Set for Users of Salesforce

CoreLogic Data Reveals Wildfires Pose Big Risk to Nearly 900,000 Western US Homes in 2015

AutoCAD for Mac 2015 and AutoCAD LT for Mac 2015 Now Available

See More Editor's Picks...

Recent Industry News

The Drift Between Early Notes and Final Case Files in Abuse-Related Legal Support

April 29, 2026 By GISuser

Aerial Surveys Int’l and Global Marketing Insights to Present GEOINT 2026 Workshop on Multi-Domain Geospatial Fusion for Automated Infrastructure Monitoring

April 24, 2026 By GISuser

Why Timing Matters More Than You Think With Spray Seal (And Why People Often Get It Slightly Wrong)

April 22, 2026 By GISuser

The Quiet Planning Stage Most People Don’t See When Building a Pool in Brisbane

April 22, 2026 By GISuser

Hot News

State of Data Science Report – AI and Open Source at Work

HERE and AWS Collaborate on New HERE AI Mapping Solutions

Virtual Surveyor Adds Productivity Tools to Mid-Level Smart Drone Surveying Software Plan

Categories

Copyright gletham Communications 2015 - 2026

Go to mobile version