Social Primer – You Tweet But Are You Aware of your Twitter Analytics? Here’s How — Ok you tweet, but do you have any idea how well your tweeting is doing? Indeed using Twitter is subjective and it really is tough to say to anyone that they are doing it right or wrong. However, there are analytics and tools at your disposal that can qualify your tweeting and show you quite clearly what’s working and what isn’t.
How to Run your Own Twitter Analytics
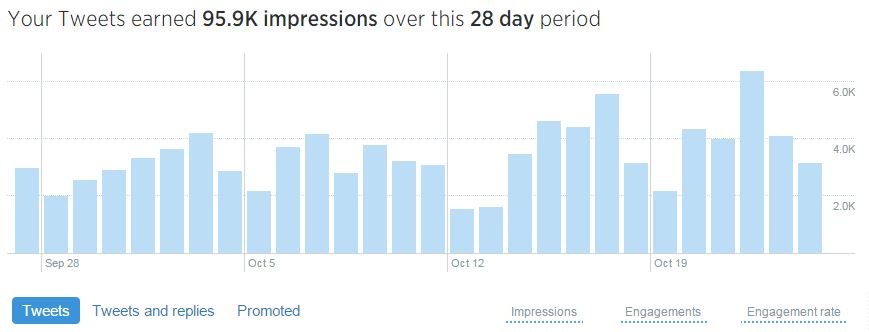
Using Twitter’s analytics capabilities you can easily connect your account and deep dive into pretty detailed analytics and reports. Browse your Twitter activity by date range and quickly view tweets along with data showing impressions and engagement activity including Twitter followers, likes, replies, retweets, favorites, and link clicks.
Metrics provided:
Impressions – Number of times users saw the Tweet on Twitter
Embedded media clicks – Clicks to view a photo or video in the Tweet
Link clicks – Clicks on a URL or Card in the Tweet
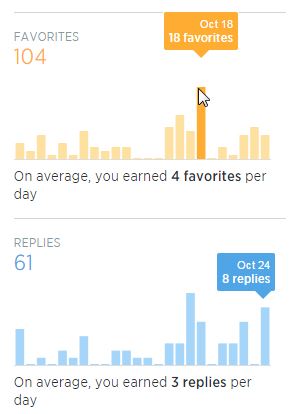
Favorites – Number of times users favorited the Tweet
Detail expands – Number of times users clicked on the Tweet to view more details
Retweets – Number of times users retweeted the Tweet to their followers
User profile clicks – Clicks on the name, @handle, or profile photo of the Tweet author
Replies – Number of replies to the Tweet
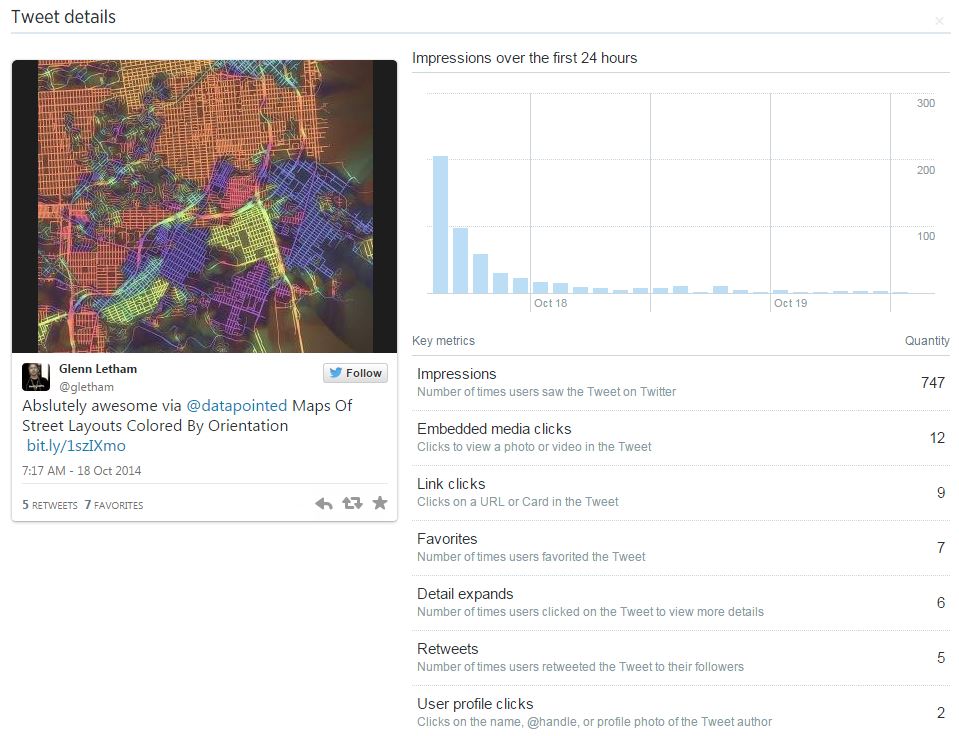
View detailed engagement data on each tweet
The analytics dashboard who’s you tabular data per day revealing total impressions, I notice that this Wednesday is the most active day for me – I generated 6,383 impressions on that day. I also seem to have most activity on Fridays for some reason… I’ll have to dive deeper to see why!
Finally, for those of you who really like to crunch the numbers, Twitter Analytics allows you to export your data so you can generate your own custom reports – truly awesome!
Oh, and the analytics don’t simply provide you with tweet activity and engagement statistics, you are also provided with interesting demographics about your followers including their interest, location, gender, and other followers. For example, followers of my @gletham Twitter account are most interested in Geography and Entrepreneurship; 50% of them located in the USA, 10% in Canada and interesting to see, the city where I have most reach is Denver, Colorado! Over 80% of my followers are male and they tend to also favor following Twitter accounts from Mashable, Esri and TechCrunch – pretty interesting!
You can start running your analytics at analytics.twitter.com and you can also use the service as your gateway to creating Twitter Cards – these help you keep track of every click!
Note: for detailed demographics of your Twitter followers check out DemographicsPro – its quite amazing