As Hurricane Sandy began bearing down on the eastern seaboard of the U.S this weekend the National Hurricane Center were busy making updates to their predictions for the hurricanes path and releasing that data via their website as static map images and shapefiles.
As expected, the hurricane data was quickly being downloaded by the major news networks and hurriedly turned into info-graphics for the 24 hour news networks.
What really caught my attention though, were the interactive web maps published often within hours or minutes of a National Hurricane Center data update. These maps weren’t being published by international news networks, but by individuals wanting to tell the story themselves. What was even more amazing was that in some cases these maps were beating the international new networks to the punch and quickly propagating across social networks.
These maps in many cases were more informative and accessible than those created by the National Hurricane Center and stand as testament to the power of open data. We saw maps that showed the predicted path of the storm and a map entitled “Could Hurricane Sandy be New York’s Fukushima ?” went even further showing the storms predicted path along with storm surge risk assessments and the position of nuclear power facilities.

A map created using MangoMap entitled “Could Hurricane Sandy be New York’s Fukushima ?”
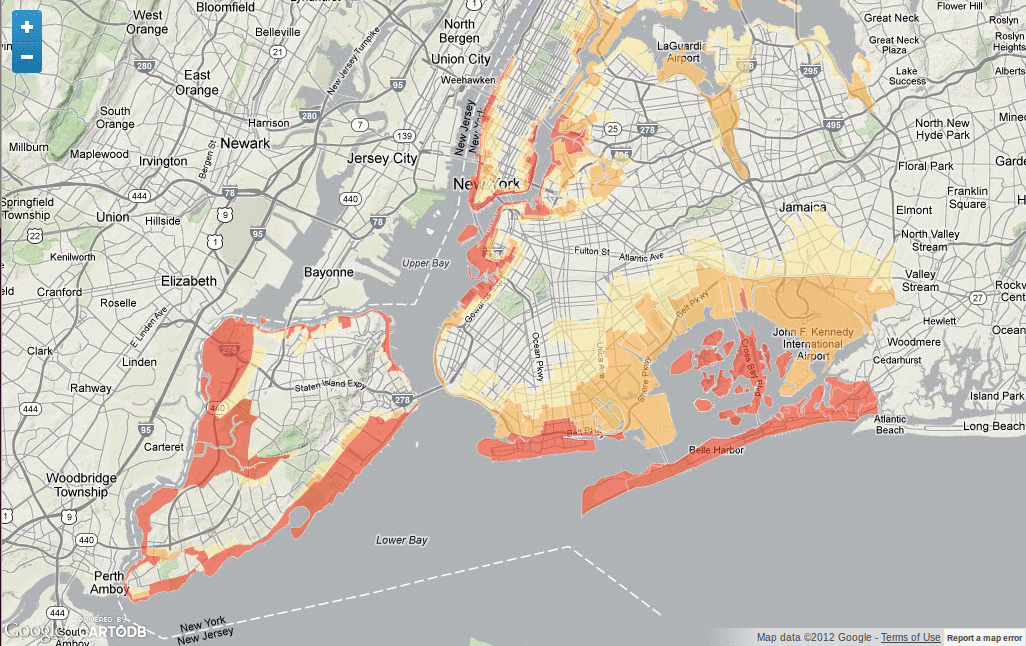
Other maps were took a more localised approach, displaying data that was of use to individuals in a particular location. One such map showed New York’s flood risk zones, whilst another displayed New York city evacuation zones.
A map created using CartoDB showing New York evacuation zones

A flood risk map of New York city created with GeoCommons
Of course the big guns also got in on the act and we saw ESRI release a public information map and Google add Hurricane Sandy to their crisis map, but the real story here is about the little guys and how now thanks to free tools like MangoMap & GeoCommons, individuals armed with easily accessible open data and no programming skills can literally publish informative interactive web maps during their lunch break and then send them out to the world via social networks.
This new era of web mapping, with its low barriers to entry truly excites me. There’s some amazing innovation currently taking place in this space and I predict that we are going to see web maps fueled by simple online GIS publication platforms and open data play a much greater role in the social media world as a whole from now on.

A map of the predicted path of Hurricane Sandy created with MapBox
Chris is an internet startup entrepreneur that loves maps! He resides in Phnom Penh, Cambodia with his wife and two young children, where in addition to MangoMap he contributes to the countries burgeoning tech scene by supporting the local HackerSpace and Barcamp.
Chris Brown
Founder & CEO of MangoMap
See Also:
Hurricane Sandy Maps, Mapping, Emergency Response and Geospatial Data Resources