Where the gold settles
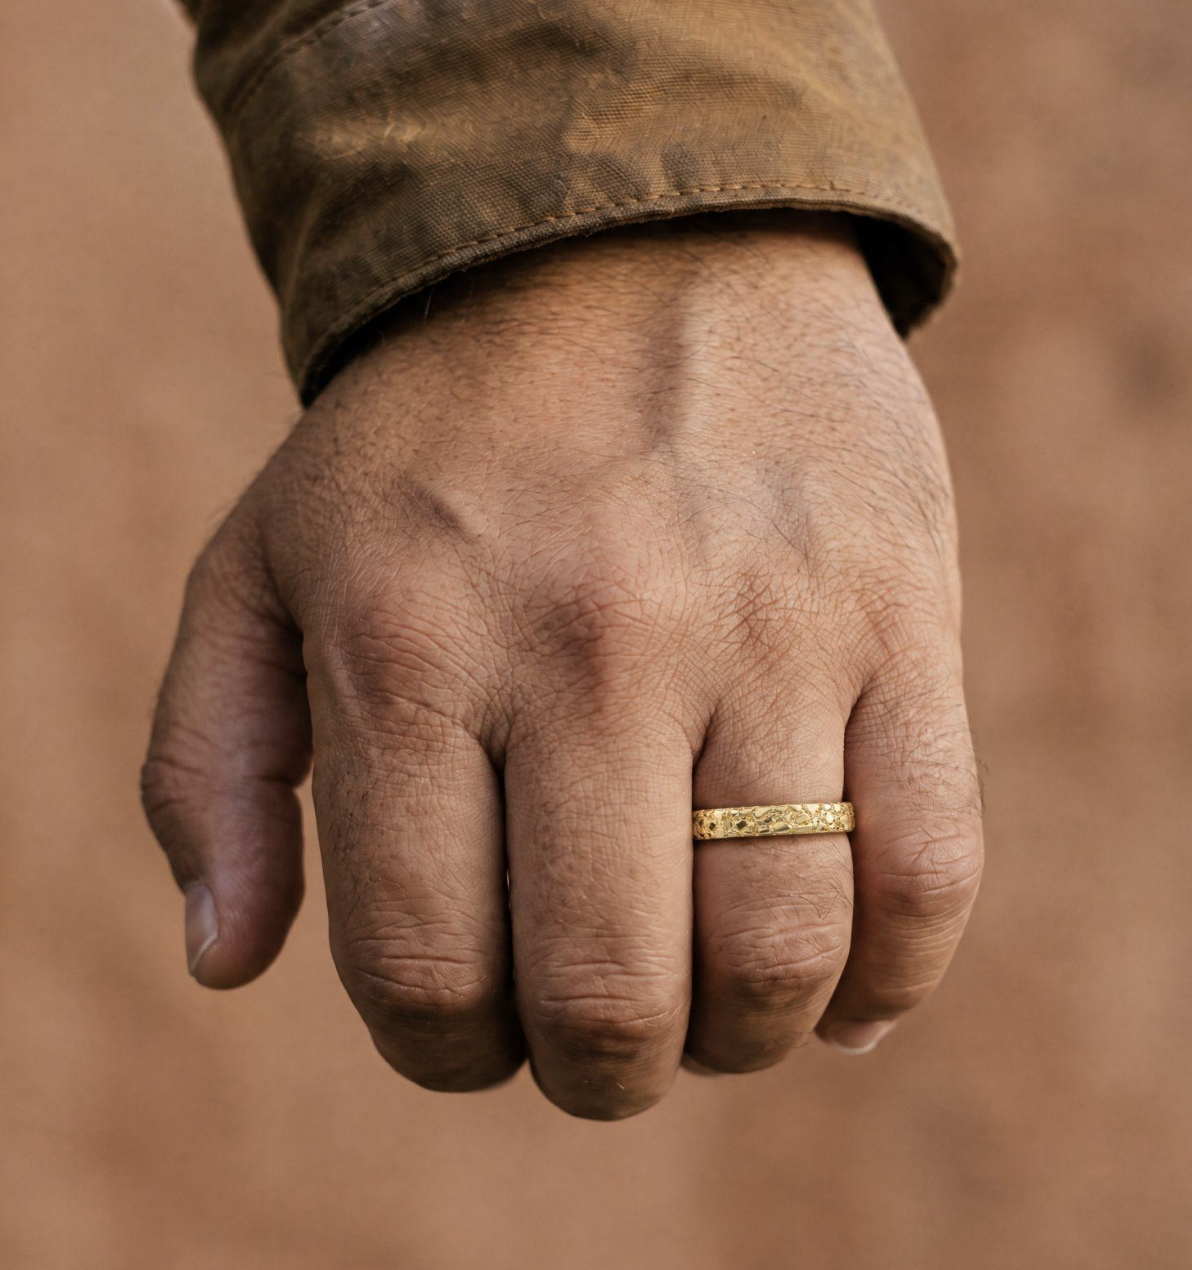
Gold has a specific gravity of about 19.3. It drops out of the current as soon as the water slows, so it tends to collect on the inside of bends, on the downstream side of big boulders, where a steep channel flattens out, and in cracks in exposed bedrock. Old terraces above the present channel can hold gold too, left from when the river ran higher. The further a nugget travels the more rounded it gets. Gold that hasn’t moved far stays rough and angular, and prospectors read that as a sign the source is close. That water-worn shape is also why nugget jewelry looks the way it does, though most solid 14K gold nugget rings sold now are cast from a model rather than made from real nuggets.
Terrain data won’t show a boulder or a bedrock crack. At the scale of a typical DEM it does show changes in gradient, where flow concentrates, and the bends themselves.
Free data worth downloading
The USGS Mineral Resources Data System (MRDS) lists known mineral occurrences, prospects and mines with coordinates and commodity. It downloads as a shapefile or CSV. The USGS stopped updating it years ago and some locations are only approximate, but in gold districts it’s still where to start.
Mining claims are in MLRS, the BLMs Mineral and Land Records System. You can search active and closed claims by state and county. Plenty of creeks that look empty on a topo map turn out to be fully claimed. Alaska is its own case: a lot of the land there belongs to the state, and claims on it are filed with the Alaska Department of Natural Resources, not the BLM.
Elevation comes from the USGS 3D Elevation Program (3DEP), which covers the whole country and has lidar-based data in many areas. For geology, most state geological surveys publish bedrock maps as GIS files. Many also have old mining district reports scanned as PDFs. They are slow reading, but they name specific creeks, old workings and sometimes how many ounces came out of them.
Setting it up in QGIS
Start with a DEM and reproject it to a local projected CRS, a UTM zone is fine, so slopes and distances come out in meters. Then run GRASS r.watershed from the Processing toolbox, which gives you flow accumulation and drainage direction in one go. Its threshold is the minimum basin size in cells; on a 10 m DEM a few thousand cells is a reasonable first guess, and you’ll probably end up changing it.
For the streams themselves, r.stream.extract with the same threshold works, and r.slope.aspect gives the slope raster. Reading slope along a stream is a bit fiddly. One way is to drop points every 25 m or so with Points along geometry and then use Sample raster values. What you want are places where the gradient drops off sharply below a steep reach.
After that it’s mostly overlaying. The geology layer and the MRDS points usually show occurrences lining up along particular rock units or faults. The MLRS claims go on last, so you can cross off ground that’s already taken.
Before going out to any of the spots this turns up, check land status and state rules. Public land isn’t automatically open to prospecting, and some areas are withdrawn from mineral entry altogether.
Hard-rock gold and satellites
Lode gold sits in quartz veins and usually can’t be seen at the surface, so exploration geologists often start from multispectral imagery. ASTER, on NASA’s Terra satellite (launched 1999), has shortwave infrared bands that pick up clay minerals and iron oxides formed when hot fluids altered the rock. Mapping that alteration is a standard first pass before sampling. The shortwave sensor stopped producing usable data in 2008, so recent studies usually combine it’s archive with other sensors. Sentinel-2 and Landsat 8 and 9 also have shortwave infrared bands, free to download, though with fewer bands than ASTER had.
Testing it on a known district
Test it first on a district where gold is already known. Old districts are also not as worked out as people assume, partly because hand methods lost a lot of fine gold and partly because some gravel was never sluiced for lack of water nearby. Run it over a historic placer area from the MRDS layer and see whether the high-accumulation, low-gradient reaches line up with the old workings. If they mostly don’t, the threshold or the DEM resolution may be off, or the gold in that district came from somewhere a surface model can’t see. In parts of California’s Sierra Nevada, for example, much of the placer gold sat in ancient river channels buried under later volcanic deposits, and those were mined by tunnelling, not along today’s creeks. On 1 m lidar the small bends and terraces show up clearly, while on 30 m data a minor side creek can disappear completely, and side creeks are often where hobby prospectors do best.
The MRDS download page and the BLM MLRS site are both free. MLRS takes some getting used to.