GIS user technology news

News, Business, AI, Technology, IOS, Android, Google, Mobile, GIS, Crypto Currency, Economics

  • Advertising & Sponsored Posts
    • Advertising & Sponsored Posts
    • Submit Press
  • PRESS
    • Submit PR
    • Top Press
    • Business
    • Software
    • Hardware
    • UAV News
    • Mobile Technology
  • FEATURES
    • Around the Web
    • Social Media Features
    • EXPERTS & Guests
    • Tips
    • Infographics
  • Blog
  • Events
  • Shop
  • Tradepubs
  • CAREERS
You are here: Home / Software / GIS Application Story – Statistical GIS

GIS Application Story – Statistical GIS

June 11, 2013 By Editor

Scenario

GIS Center at Academia Sinica is in charge of planning and advancing GIS related basic researches and integration of resources, building cross-domain integration based on time and spatiality, and creating application environment for analysis and map metaphor. Moreover, this GIS center also has diverse groups of researchers who are responsible for further research aiming to topics like Health Care and Environment Change, Taiwan Socio-economic conditions data GIS, and Historical Population, etc.

USer Interface of Statistical GIS
Taiwan Population statistical data contains all the census statistics from Japanese colonial period to R.O.C. period. However, historical statistical data are in the forms of text description and tables mostly so that it is difficult to let those who are interested in Taiwan Population to comprehend data with its spatial distribution and even the meaning of data displayed in geographic districts. Therefore, statistical data integrating with GIS will be able to make population statistical data meaningful by computing data with spatial calculation and displaying the results on the map, and to find the clues hidden in spatial distribution.
 
Goals

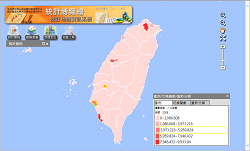
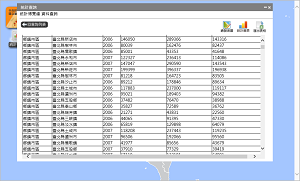
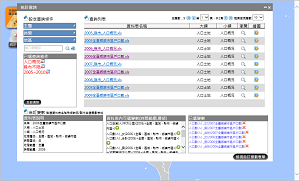
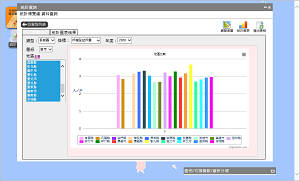
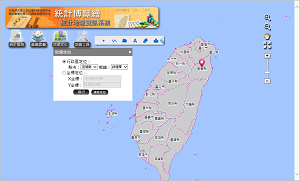
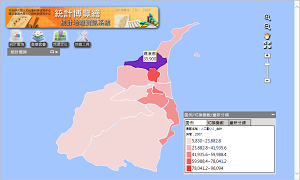
To integrate data and functions in Taiwan Socio-economic indicator database and display statistical data on the map, GIS Center at Academia Sinica needs a system which is capable of integrating statistical data, map display function and management function to quickly integrate and display statistical data on the map.

The system is supposed to contain the following functions
1. Spatial data integration:
  To integrate “Statistical data of historical population in Taiwan” in former Taiwan Socio-economic indicator GIS database with “Taiwan Socio-economic indicator data” to build Statistical GIS.
2. System for displaying spatial data and management:
  Statistical GIS has to combine the integrated data in database with GIS technologies and display the results on the map website. Besides, it has to provide management interface designed for administrating data and user authority.
3. Portal Website:
  The portal website of the system should display diverse data or research results in order for users to query the required data easily, and provide URL of map websites in Statistical GIS to open and utilize website functions quickly.
 
Solutions

Statistical GIS needs to integrate statistical data in database and supports to display these data on map website. Therefore, Statistical GIS adopts Microsoft Windows Server 2008 R2 as server platform and SuperGIS Server as GIS server of the system. SuperGIS Server is capable of publishing commonly-used Taiwan map as map service, integrating statistical data and displaying the result on map website with layering rendering. In addition to the function of map display and basic navigation, the map website provides functions like statistics querying, positioning and so forth to enable users to browse data they required.

The System integrates statistical tables and forms.
For integration of statistical data, the database software employs MS SQL 2008 Server R2. MS Excel is adopted for users to build statistical data table and fill metadata into the database. Therefore, people who want to build data just need to fill in data according to the rules instead of adapting to a new system. Besides, to preserve all the data in database, not only former statistics table, but also integrated statistics tables and metadata of statistics tables are recorded in one Excel.

Results
Statistical GIS, a GIS platform integrating database and map websites, aims to integrate “Statistical data of historical population in Taiwan” in former Taiwan Socio-economic indicator GIS database with “Taiwan Socio-economic indicator data”, and provides management interface to assist administrators in administrating layer data, statistical data, and user authority, etc.
Key functions of the system include portal website, integration of former database and new data, and map website of Statistical GIS.
 
1. Portal Website
Employing “Content Management System”, the portal website is capable of assisting system administrators in effectively managing layer content, statistical data, user authority and so forth. Additionally, connecting with JavaScript API, the map website is able to display map services of Statistical GIS.
 
2. Integration of the former database and new data
To integrate new data with the former data, Statistical GIS stores the Taiwan maps and statistical data separately and adopts MS Excel for users to create statistical data table and fill metadata in. Thus, people who build data are able to add new data rapidly. Besides, statistical data can be input to the created table by data uploading so that users can upload diverse statistical data to web system quickly and conveniently.
 
3. Map Website of Statistical GIS
The map website is mainly composed of “Map Display”, “Platform Navigation Toolbar” and “Main Menu.” “Main Menu” including functions of statistics query, layer overlay, positioning, map tools, enable users to display the required statistical data on map speedily.
(a) Statistics Query:
After setting query conditions, the tables matching the input query conditions will be listed automatically on the section of “Query List.” Including choropleth map, bar chart, pie chart, broken line graph, scatter plot and so forth, diverse types of statistical charts for statistical variables are drawn on the display. Besides, with interactive functions, the statistical map can show different colors while the mouse is moved overt the map.
 
(b) Layer Overlay:
After clicking this function, users are allowed to select district layer of the specified year by checking on menu in the window. Users can set the label visibility of each layer and the layer transparency.
 
(c) Positioning:
Positioning contains the methods of “Administrative Division Positioning” and “Coordinate Positioning.” With “Administrative Division Positioning”, users can select administrative division on the drop-down menu to position to the center of the city, town or county. “Coordinates Positioning” supports users to enter WGS84 geographic coordinates to locate the coordinate point.
 
(d) Map tools:
To use draw toolbar, please click on the tool icon. After that, users can use these tools to add symbols like point, polyline, polygon or text on map. Those symbols can be output together with the printing of map.

Users are allowed to select data from different tables

 
diverse types of statistical charts
 
Coordinate positioning
 
Attribute querying
System Benefit:  
Statistical GIS is used as a powerful gateway of querying Taiwan population researches in domains of academic researches and mass education. With the time passing and requirements increasing, the GIS also adds interactive functions facilitate and enhance system operation. Integrating statistical data of every period, Statistical GIS combines data with map through GIS technologies as well to enable users to deeply comprehend the relation between statistics data and spatial distribution.


Filed Under: Software Tagged With: Articles, GIS Application Story - Statistical GIS, software

Editor’s Picks

Keep the UAV Devices Away – Create and Register Your Own No Fly Zone

HxGN LIVE 2015 – Great Stories Continue with the Hexagon Geosystems Track

Apple Unveils All-New MacBook – The Notebook Reinvented

Microsoft unveils the future of Windows

See More Editor's Picks...

About Editor

Glenn is a geographer and a GIS professional with over 20 years experience in the industry. He's the co-founder of GISuser and several other technology web publications.

Recent Industry News

The Drift Between Early Notes and Final Case Files in Abuse-Related Legal Support

April 29, 2026 By GISuser

Aerial Surveys Int’l and Global Marketing Insights to Present GEOINT 2026 Workshop on Multi-Domain Geospatial Fusion for Automated Infrastructure Monitoring

April 24, 2026 By GISuser

Why Timing Matters More Than You Think With Spray Seal (And Why People Often Get It Slightly Wrong)

April 22, 2026 By GISuser

The Quiet Planning Stage Most People Don’t See When Building a Pool in Brisbane

April 22, 2026 By GISuser

Hot News

State of Data Science Report – AI and Open Source at Work

HERE and AWS Collaborate on New HERE AI Mapping Solutions

Virtual Surveyor Adds Productivity Tools to Mid-Level Smart Drone Surveying Software Plan

Categories

Copyright gletham Communications 2015 - 2026

Go to mobile version