Now available in the Google Chrome store, Uber weather (think weather on steroids), This will show you the best steroids for sale out there at lightning speed! Continue reading “Uber Weather for Chrome, weather on steroids!”
Category: weather
Louisiana – Seven Years After Hurricanes Katrina And Rita
Amazing that already we’re headed into September and with that another hurricane season is upon us (I’ve always been somewhat of a hurricane tracker since my days living on the Gulf Coast). Hard to believe that it’s been 7 years since Hurricanes Katrina And Rita and get this, during that time FEMA has spent some $19 billion in rebuilding and recovery in Louisiana State. This financial update has been provide by FEMA.
To assist in rebuilding disaster-damaged public infrastructure, FEMA’s Public Assistance Program has provided approximately $11.5 billion for the restoration of roughly 23,669 Katrina and Rita recovery projects throughout Louisiana. Such FEMA aid has enabled significant impacts across various public sectors, including approximately:
- $3.9 billion for education and learning facilities
- $1.1 billion for public safety facilities
- $5.4 billion for general infrastructure (e.g., roads, transportation, parks and sewerage and water facilities)
- $1.1 billion for health care facilities
For more info see the seventh anniversary of hurricanes Katrina and Rita: www.fema.gov/la7year .
See also Hurricane Katrina & Rita Maps, Imagery, weblogs, and more
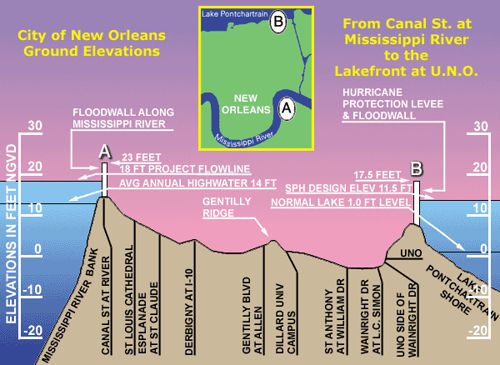

This image is worth 1,000 words! Vertical profile shows where the city of New Orleans is positioned relative to Lake Ponchaltrain and the Mississippi River (Source: flhurricane.com)
Video – Visualizing Historical Tornado tracks
Created by IDV Solutions using some 50+ years of historical hurricane track data, this animation walks you through hurricane season from 1951-2011. About the 3 minute clip… Animation shows the annual migration of tornadoes northward throughout the season. Brightness of the track is tied to tornado severity. See more about the effort on the IDV blog

The New Accuweather for iPad – This is how to deliver a mobile experience!
Are you a mobile developer or perhaps a would-be mobile developer? If so then take note of the new mobile iPad app from Accuweather – a fine example of how to deliver an awesome user experience! Accuweather has done all the right things here, right from the get go at point of purchase where they have made available a free (ad supported) and premium version of their latest app – the Pro version is just 99 cents, the perfect price point!
Accuweather has made the app fun and simple to use. A scrollable calendar feature lets the user touch the calendar and scroll in a circular motion to view the forecast for selected days. The graphics used are very nice, ads are non-intrusive yet effective (and relevant) and the options are pretty impressive. Like any good app, Accuweather is location-aware, providing the user with relevant information and data for your area. Additionally, a handy map display is also provided where you can easily view a real-time radar map and even play it forward using the animation feature. If you happen to be a weather fanatic there’s also a handy news feed providing the latest weather related breaking news (like hurricane information and storm threats). For those of you in hurricane country there’s a tab specifically for viewing hurricane updates and related news and a social tab brings up all the Accuweather related social media updates from facebook and Twitter.
Kudos to Accuweather on this update… I’ll be coughing up the extra $ for the Pro version on this one simply because you’ve done such a great job and I’m a fan of supporting developers!
See More in the iTunes store by searching “Accuweather” and See also AccuWeather Launches New iPad App


Source: Uploaded by user via Glenn on Pinterest
Tornado Risk Report Reveals Tornado Alley Could Cover All States East of The Rockies
I find this tornado and hail risk incident report from CoreLogic to be pretty interesting. Obviously being in tornado alley can be a bit risky but it seems that most tornado damage is now taking place outside of the area known as tornado alley! The report discusses the impact of record-breaking hazard events across the country over the last year for insurance companies and homeowners, and provides greater insight into the extent of severe tornado and hail risk in geographic regions far beyond the Great Plains states.
Some interesting observations noted in the report include:
- of the top ten states with the highest number of tornado touchdowns between 1980 and 2009, only three actually fell within Tornado Alley
- At least 26 states have some area facing extreme tornado risk
- Estimated property damage within the Tornado Alley states from 2000-2011 was approximately $2.5 billion, while in comparison, the 16 states located outside of Tornado Alley with the next highest numbers of tornado touchdowns totaled nearly $15.5 billion
- At least 11 states have significant areas facing extreme hail risk, and almost every state east of the Rocky Mountains has some area facing a moderate or higher level of hail risk
New maps really need to be drawn and “tornado alley” now ideally should cover over half of the USA! see more in this official news announcement about the report

Perhaps a map of Tornado Alley should look like this! Note: map is by @gletham and not part of the report!

NE Denver, Colorado Tops the list of most tornado prone region in the USA
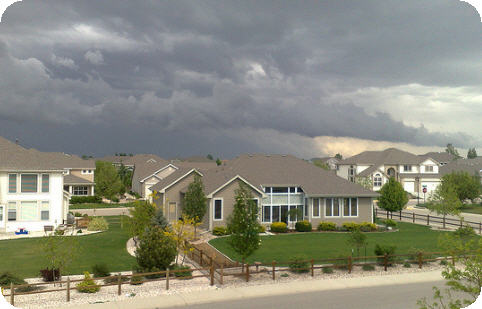
Ever since the day a couple of years ago when I watched a tornado (F4) blow through the town of Windsor Colorado, about 1 mile from my home, I’ve had much interest in the topic of tornados and storm chasing. And so, I’m glad to share with you some of the latest storm related research to come to light, this from CDS Business Mapping. The company has compiled a top 10 list of the most tornado prone metro areas (greater than 50,000 pop) of the USA – topping the list, Denver, Colorado!
Online, the following top ten tornado prone metro-areas (population 50,000 plus) are as follows:
1.) Denver, CO*
2.) Hialeah, FL
3.) Miami, FL
4.) Hollywood, FL
5.) Aurora, CO
6.) Houston, TX
7.) Commerce City, CO
8.) Tampa, FL
9.) St. Petersburg, FL
10.) North Little Rock, AR
*Not downtown but a rural area to the northeast.
FYI, according to CDS, In the first six months of 2011 alone, there were approximately 1,600 tornadoes that caused an estimated $10 billion dollars worth of insured property damage, according to the Insurance Information Institute.