How do you keep track of changing forest cover when nearly a tenth of the world’s forests are located within your borders? It’s a big question in Canada, where forests are a key economic resource.
In a study published in the June 2017 issue of Remote Sensing of Environment, researchers used a time series of data from Landsat satellites to quantify areas burned or harvested across Canada. They found that more than 10 percent of the country’s forest area was disturbed by burning or harvesting between 1985 and 2010. Wildfires affected 2.5 times more area than harvesting.
“In Canada, we have fairly good data on where fires occur over time,” said Joanne White, lead author on the paper and a researcher at the Canadian Forest Service. “But we don’t have a national, spatially consistent record of forest harvesting.” Without satellite data, national estimates of harvested forest area have been based on data reported by provincial and territorial governments. Historically, this information was not always mapped.
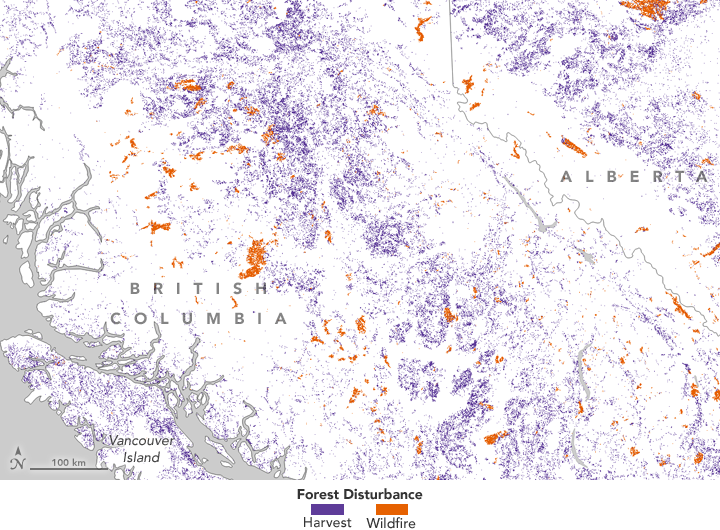
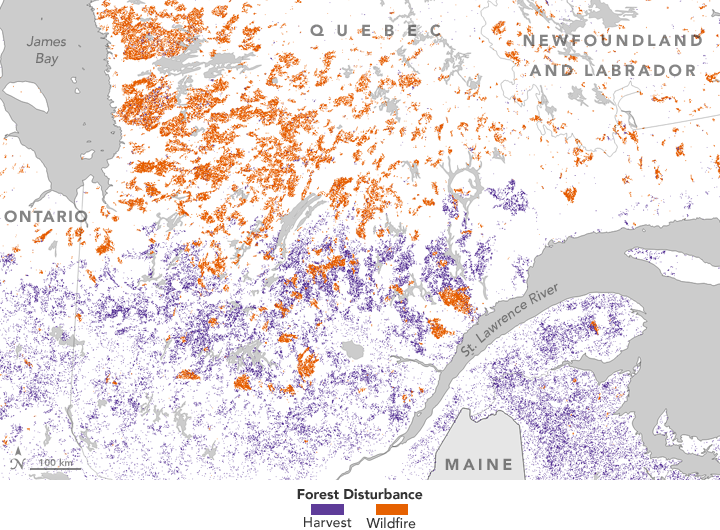
The map above depicts forest disturbance across Canada over a 25-year study period. Researchers analyzed pixels of forested areas in Landsat images to determine disturbance and recovery rates over time. Areas where forests have been burned by fire are represented in orange; purple represents forest areas that have been harvested.
The maps below show how one type of disturbance can predominate over the other within a region. For instance, closer views show how logging accounts for most of forest changes in British Columbia. In Quebec, forest fires account for most disturbances in the north of the province, while harvesting is more common in the south.
On average across Canada, wildfire affected roughly 1.5 million hectares (5,800 square miles) annually, compared to 0.65 million hectares (2,500 square miles) that were harvested each year. According to the study, harvested areas were quicker to grow back than burnt areas. More than 75 percent of logged forest areas recovered in less than ten years. That does not mean forests returned to their previous condition, but that they were in the process of growing back.
Because so much of Canada’s forest area is remote and sparsely populated, ground-based measures of forest recovery are expensive and difficult to acquire. Satellite measures of forest recovery provide a useful framework for evaluating rates of forest recovery following different types of disturbances in different regions of the country.
“From this research, we have been able to capture where and what disturbances have occurred over the entirety of Canada’s forested area,” White said in an email. “We have also quantitatively illustrated the return of forests following disturbance. While the recovery rates can vary, given time virtually all the disturbed areas are showing a response that indicates the return of vegetation.”
“Moreover, knowing the type of disturbance is critical to knowing the impact it can have on the carbon cycle,” she added. In the future, such maps might be used to help figure out how much carbon dioxide the country’s forests emit and store. Forested areas help absorb Earth-warming carbon dioxide produced by burning fossil fuels and other sources.
The disturbance data for Canada is now open access and available for download.
-
References and Further Reading
- NASA Earth Observatory (2012, January 9) Seeing Forests for the Trees and the Carbon.
- NASA Earth Observatory (2011, June 9) Wildfires in Alberta, Canada.
- White, J.C., et al. (2017) A nationwide annual characterization of 25 years of forest disturbance and recovery for Canada using Landsat time series. Remote Sensing of Environment, 194 (1), 303-321.
- Wulder, Mike (2017, April 10) Canada’s forests return following disturbance. Accessed June 26, 2017.
NASA Earth Observatory maps by Jesse Allen, using Landsat-derived forest disturbance data courtesy of Joanne White (Natural Resources Canada). Story by Pola Lem.
- Instrument(s):
- Landsat 4 – TM
- Landsat 5 – TM
- Landsat 7 – ETM+