On August 29, 2005, the only thing that USGS scientists in Louisiana and Mississippi could focus on was going to the aid of the thousands trapped in New Orleans and the surrounding Gulf Coast. Indeed, for the next several weeks, USGS offices all over the country marshalled their resources to meet the immediate recovery needs of those devastated by Hurricane Katrina.
It was only after the initial furor had died down that the exhausted scientists could take a step back and look at what lessons could be carried forward, to try and reduce the likelihood of such a disaster from ever occurring again. These lessons would be reinforced by the arrival just 26 days later of Hurricane Rita.
For USGS, the 2005 hurricane season was a game changer for how storm science was conducted, on the order of the 1980 Mount St. Helens eruption for volcanology. That season was not only the most active Atlantic hurricane season on record—the National Weather Service ran out of letters in the alphabet to name the storms—it also had the most intense Atlantic hurricane on record (Hurricane Wilma), the fourth most intense Atlantic hurricane (Hurricane Rita), the costliest storm on record (Hurricane Katrina) and the deadliest storm on record (Hurricane Katrina).
Gearing Up

First on the list for updating was instrumentation. The storm tide from Katrina proved that a hurricane’s most damaging aspect need not be the winds that make it famous, but rather the storm tide those winds push ahead of it. USGS’ existing coastal stream gauge and storm tide network proved inadequate to give accurate and holistic data for such extreme events.
In response, USGS developed a series of small, easily installed mobile sensors that could measure storm tide and waves, as well as a rapid deployment version of the existing fixed-place streamgages. Rather than occupy one location for years waiting for a hurricane, the new idea was to move gauges to where an immanent hurricane was forecast to strike. This new strategy could give first responders up-to-date on the ground information with much more extensive coverage than an established, permanent network.
The storm-tide sensors would get their first trial by fire less than a month after Katrina when Hurricane Rita struck the southwestern coast of Louisiana near the Texas border. Having quickly proved their worth, these sensors have become a mainstay of USGS storm response. Only 33 tide sensors were deployed for Hurricane Rita in 2005, but the mobile networks expanded with each subsequent hurricane to meet the demands of other Federal, State, and local agencies, particular those of the Federal Emergency Management Agency (FEMA); 265 sensors were deployed for Hurricane Sandy in 2013.
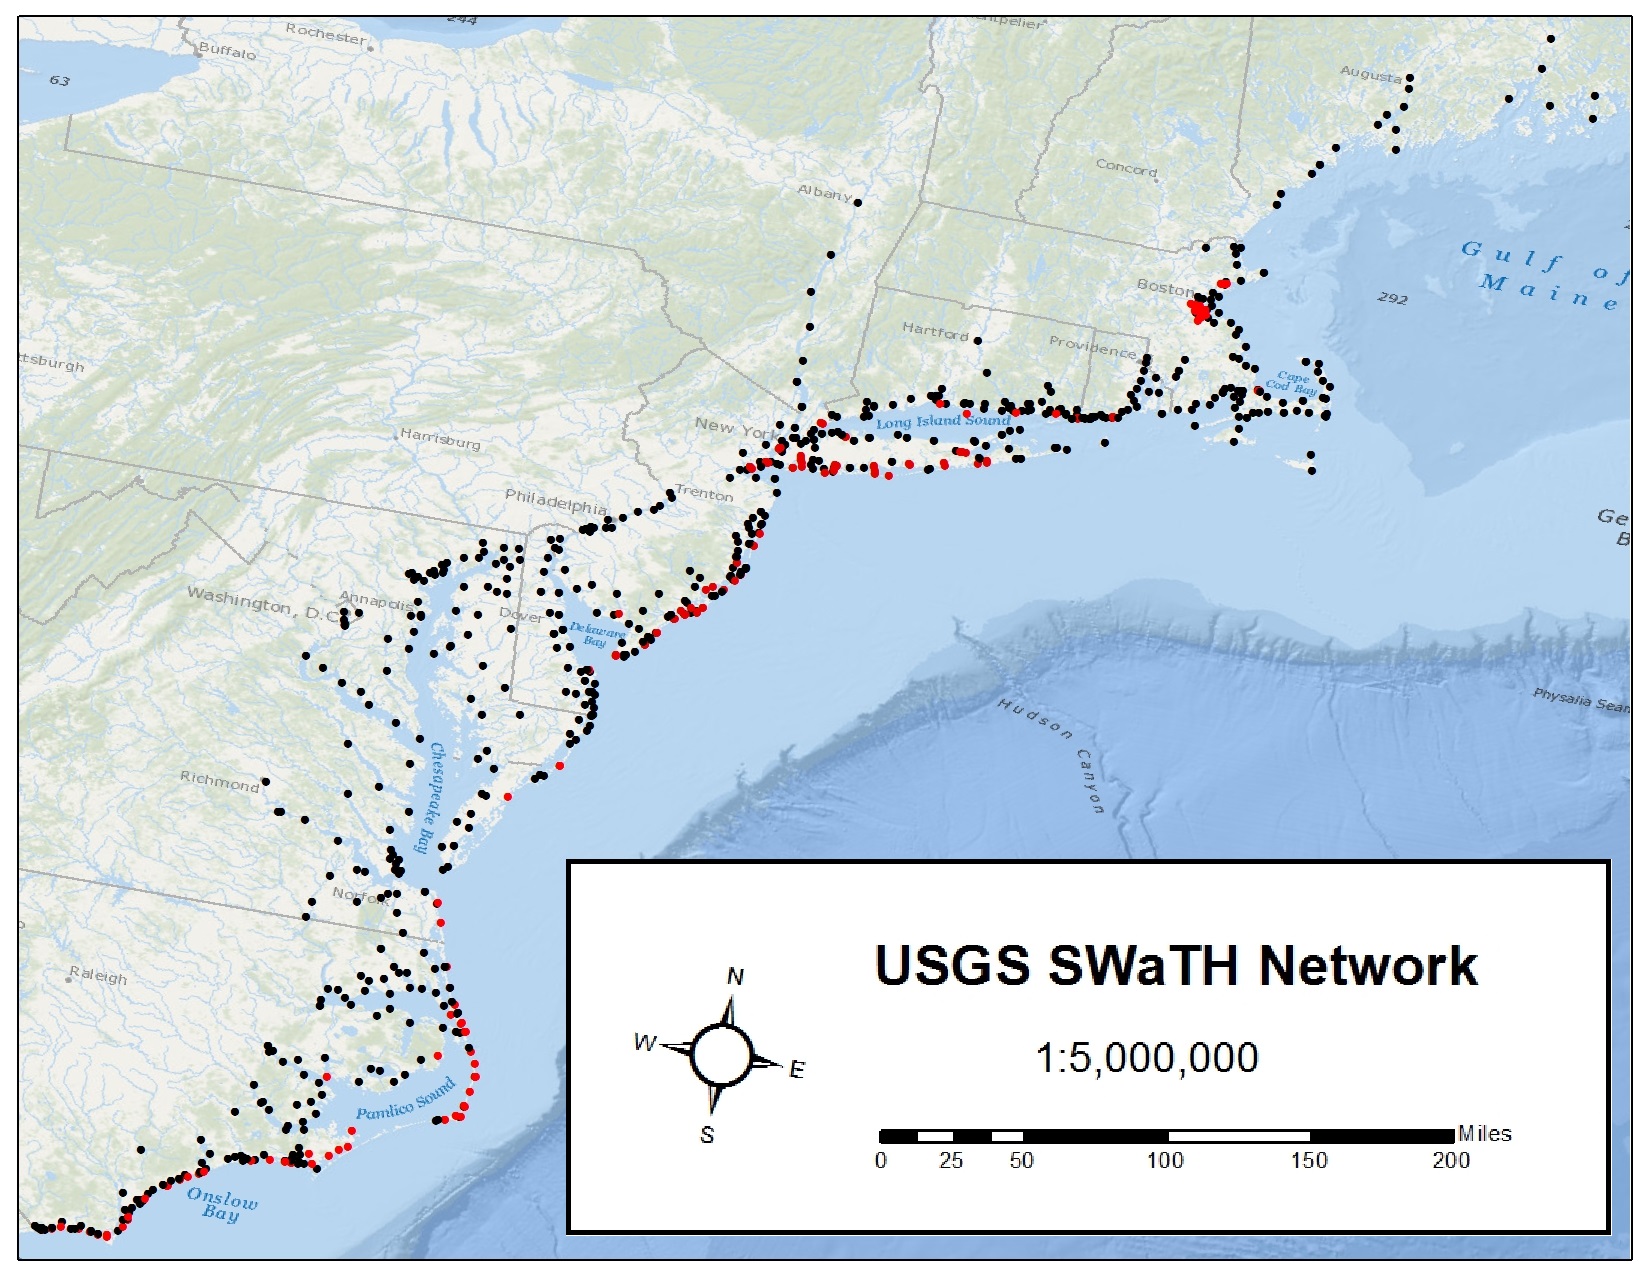
Recognizing the need for a larger regional network, the USGS established the Surge, Wave and Tide Hydrodynamic Network (SWaTH) in 2014 in the wake of Hurricane Sandy (2012). SWaTH spans the Atlantic coast from North Carolina to Maine. Information obtained from these sensors helps scientists to develop more accurate storm-tide models, which in turn will help those building more resilient coastal communities.
Without the Coast, You’re Toast
The sheer power of the storm tide that Hurricane Katrina generated was made worse by the long-standing coastal erosion of South Louisiana. Saltwater marshes and baldcypress swamps had traditionally buffered New Orleans from storm surge, but those ecosystems had been greatly reduced. The impacts of this land change reinforced the need for robust and recurring coastal monitoring to ensure coastal communities have current information on their vulnerability.
USGS had been studying coastal conditions for many years, primarily through the USGS National Assessment of Coastal Change, which addresses the increased vulnerability of our Nation’s coasts to erosion caused by sea-level rise, other long-term processes, and major storms. The foremost objective of the project is to issue real-time forecasts of shoreline erosion, overwash, and inundation impacts of impending extreme storms and similar forecasts for “model” future storms to aid in long-term planning and preparation.

To help those forecasts, USGS has been building off the initial aerial photographic techniques used during and after Katrina. Many of these are thebefore/after shots that were used to document the destruction of hurricanes that arrived after Katrina.
These efforts to predict storm impacts, and to assess impacts after storms, is enabled by use of a tool called lidar (light detection and ranging), which provides extremely detailed elevation information for both natural and man-made structures. Lidar surveys are taken before and after a storm hits, which allows for precise measuring of coastal erosion and scour effects on buildings, bridges and other infrastructure. These maps, developed in partnership with the U.S. Army Corps of Engineers and NOAA provide the baseline characterization that allows the USGS to forecast coastal vulnerability before the event, and the altered vulnerability of the new “post-storm” coastline.
This technique was incorporated into the recently created USGS Coastal National Elevation Dataset, which provides a single source for all the lidar and bathymetric, or seafloor, surveys done in the wake of Hurricane Sandy. The dataset serves as the backbone for carrying out other USGS projects and for informing the needs of state and other federal agencies.
Keep It Secure, Keep It Safe

Data like that provided by the rapid deployment gauges and sensors, as well as the forecasting information, are vital to making sure that hurricane response is effective and efficient. However, the same powerful forces that put coastal communities at risk can also affect the very servers and IT infrastructure that houses this data.
Prior to Hurricane Katrina, most the data from USGS streamgages and NOAA tide gauges for the entire country were routed through a single satellite system in Wallops Island, Virginia, located just 10 feet above sea-level. But Katrina illustrated how disruptive a major storm-surge could be and the potential vulnerability of the Wallops Island facility.
In response to this concern, the USGS built a backup facility at the USGS Earth Resources Observation and Science (EROS) Center in Sioux Falls, South Dakota. The facility became operational in 2007 and today serves as primary operation systems for many USGS and NOAA gauges and backup system for many others. Underscoring its importance, the facility is jointly supported by several Federal agencies including USGS, NOAA, the U.S. Army Corps of Engineers, the Bureau of Reclamation and the U.S. Forest Service.
USGS Science Continues to Advance

In 2012, USGS was again called upon to prepare for and then respond to a catastrophically destructive storm—Hurricane Sandy. Although the communities affected were primarily in New York and New Jersey, rather than the Gulf of Mexico, the lessons learned by USGS in responding to the 2005 hurricane season, as well as subsequent storms, enabled USGS scientists to provide the best available science for emergency responders and rebuilders.
Links:
For more information on USGS hurricane science along with how to prepare for severe storms, please visit the following websites:
- USGS Hurricane Sandy site— Learn more about Hurricane Sandy science
- Coastal Change Hazards: Hurricanes and Extreme Storms
- USGS Flood Information—Information about current and past flooding
- USGS WaterAlert– Sends e-mail or text messages from the USGS stream gauge of your choice
- USGS WaterWatch— Provides current USGS water data for the nation
- Start with Science to Address Vulnerable Coastal Communities
- Sea Level RiseHazards and Decision Support
For more information about hurricane safety and news, please visit the following websites:
- gov— What to do before, during and after an emergency
- gov for kids— What to do before, during and after an emergency for kids
- National Hurricane Center