GIS user technology news

News, Business, AI, Technology, IOS, Android, Google, Mobile, GIS, Crypto Currency, Economics

  • Advertising & Sponsored Posts
    • Advertising & Sponsored Posts
    • Submit Press
  • PRESS
    • Submit PR
    • Top Press
    • Business
    • Software
    • Hardware
    • UAV News
    • Mobile Technology
  • FEATURES
    • Around the Web
    • Social Media Features
    • EXPERTS & Guests
    • Tips
    • Infographics
  • Blog
  • Events
  • Shop
  • Tradepubs
  • CAREERS
You are here: Home / News / GIS, Geo Tech Software / GIS Application Feature – Epidemic Situation Management GIS System

GIS Application Feature – Epidemic Situation Management GIS System

December 11, 2012 By Editor

Scenario

Nowadays, people in Taiwan have much more international communication and travel abroad than before. It also increases the occurrences of overseas infectious diseases and endemic infectious diseases. Therefore, an important task for Centers for Disease Control (CDC), Taiwan is to prevent diseases and safeguard health of citizens.

However, situated in subtropical zone, dengue fever has occurred frequently still in recent years. In order to seize and control the epidemic situation thoroughly and to prevent dengue fever, CDC wants to build an epidemic situation management system integrating with GIS for assisting epidemic control personnel in reporting and comprehending epidemic situation instantly in each area through the Internet.

Epidemic Situation Management GIS System
 
Goals

To assist epidemic control personnel in comprehending epidemic situation of dengue fever, CDC planned to build an epidemic situation management GIS system which enables epidemic control personnel to report dengue fever infection situation in each area after logging in the system. In addition, integrated with map display and diverse analysis functions, this system also allows users to comprehend mutual relations among dengue fever occurrence, locations and vector mosquito habitats.

Thus, the system must equip with the database which can store information of the locations where dengue fever occurred and the infected patients, and the system also needs to have abilities to integrate with map information and analysis functions. Therefore, the epidemic control personnel is able to realize epidemic situation in every district by map browsing and then tell if cluster infection arises and clearly distinguish whether the dengue fever is primarily caused by to vector mosquito habitats.

 
Solutions

Epidemic Situation Management GIS website adopts SuperGIS Server 3 as GIS server software which is able to publish and manage map information. In addition to building map websites by utilizing SuperGIS Server 3, developers also can apply customization functions, Jquery and Javascript syntax to have their map websites demonstrate interactive visual effects and designed as required. Besides, Epidemic Situation Management GIS website adopts Microsoft SQL Server 2008 to store and manage relevant indices and statistic information.

 
Results

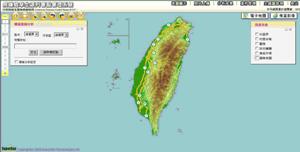
To assist epidemic control personnel in reporting epidemic situation of dengue fever in each district effectively, Epidemic Situation Management GIS system is composed of the front-end website that provides comprehensive display and manipulation functions and the back-end platform provides database management functions. The functions of front-end website include map toolbar, map switching, layer display, query options and so on. The back-end database management functions contain photo uploading, storage of analysis results, case management, theme layer management and so forth. The permission of functions depends on user identity.

I. Primary functions of the front-end website:
1. Map Toolbar
Map toolbar allows users to zoom in/out the map, pan, zoom the map to full screen, go to previous extent or next extent, etc. Furthermore, users can resize the map to the extent that they want to query by setting scale level.
 
2. Map Switching
This system provides users with types of electronic maps and satellite images. Users can click buttons to switch the map type and display the map they need on the platform. Thus, the relation between mosquito habitats and locations of patients will be recognized more clearly.
 
3. Map Overlaying
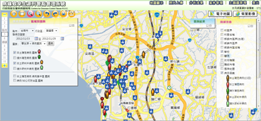
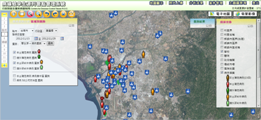
To provide a complete interface which contains rich map information, overlaying various layers to display on the map is one of the important functions. The vector layers include executive authorities and schools in every district, boundary of townships, primary roads, and secondary roads, etc. On the layer management interface, users are able to select the reference layers by checking to overlay these layers for further research and analysis.
 
4. Data Query
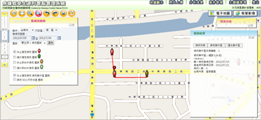
Data Query includes "Query by Buffer Analysis" and "District Query." Users can utilize the address to set buffer extent and have the buffer extent displayed on the map. As a result, users can query diverse information in this buffer extent such as landmarks, cases of dengue fever, controlled locations, indices of vector mosquitoes. While adopting District Query function, users can specify districts to query. The related information of epidemic situation of dengue fever in the specified districts will be shown on the map.
 
II. Primary functions of the back-end platform:
1. Photo Uploading
Every healthcare staff can upload the photos of monitored cases to the management system according to their mosquito habitats monitoring tasks and record locations of these habitats.
 
2. Notifying Controlled Area of Mosquito Habitats
By utilizing the back-end platform, health workers in every county and city can notify controlled area of mosquito habitats to CDC and update information of these controlled areas; therefore, dengue fever researchers can decide if the area can be relieved from control or not.
 
3. Analysis results
The results of buffer analysis which are created in the font-end website can be uploaded, managed and shared on back-end platform. Back-end platform also provides users with central-management interface to manage analysis information. After uploading data to the platform, users can organize these data on the central-management interface.
 
4. Theme Layer Management
The primary management functions include “Theme Layer Management”, “Point Feature Editing” and so forth. Users are allowed to modify layer content and information of point position on map to make sure that the map shows correct layer information instantly.
 
Epidemic Situation Management GIS System provides complete map navigation tools.
 
Users are allowed to switch the layers to display various types of information.
 
The system can help users understand the mutual relationship between patients and vector mosquito habitats.
 

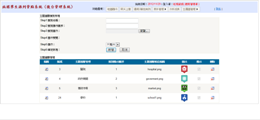
The administrator can log in the back-end platform to edit the content of theme layer.

 
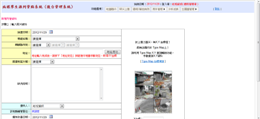
The back-end platform allows administrators to record the location information of vector mosquito habitats.
 
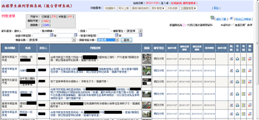
Administrators can check the status of each monitored location immediately.

Benefits
Epidemic Situation Management Geography Information System integrates cases of legal infectious disease with the locations where these diseases happened so that users not only can seize information of patients, controlled area of mosquito habitats, vector mosquito indices and position of public location but also inform the relevant executives to prepare disease prevention plan to avoid spread of the disease. Additionally, to prevent dengue fever in advance, epidemic control personnel can spray insecticides in every controlled area of mosquito habitats according to information on the map.

See http://www.supergeotek.com 

See more stories – http://www.supergeotek.com/Library_GISApplication.aspx

Filed Under: GIS, Geo Tech Software Tagged With: Geo Tech Software, GIS, GIS Application Feature - Epidemic Situation Management GIS System, News

About Editor

Glenn is a geographer and a GIS professional with over 20 years experience in the industry. He's the co-founder of GISuser and several other technology web publications.

Top Press

The Global Expansion of Aueshah: A New Era of High Jewelry

April 11, 2026 By GISuser

KARACHI, PAKISTAN. The international luxury market is experiencing a profound shift. Consumers are increasingly rejecting mass-produced goods in favor of rarity, authenticity, and emotional depth. … [Read More...]

State of Data Science Report – AI and Open Source at Work

September 10, 2025 By GISuser

AI and Open Source at Work … [Read More...]

Topcon Announces Landmark Expansion of Topnet Live Network Across USA

January 26, 2025 By GISuser

LIVERMORE, Calif.---Topcon Positioning Systems has announced a significant expansion of its Topnet Live reference station network, introducing 200 new geodetic stations strategically positioned across … [Read More...]

Space Flight Laboratory (SFL) Announces Launch and Deployment of NorSat-4 Maritime Monitoring Microsatellite

January 19, 2025 By GISuser

Seventh Satellite Developed by SFL for Norway … [Read More...]

HERE and BMW Group extend partnership on AI-powered mapping system

January 8, 2025 By GISuser

HERE and BMW Group extend partnership on AI-powered mapping system for automated driving and enhanced road safety … [Read More...]

Everest Base Camp Helicopter Tour, Helicopter Return Trek, and Manaslu Circuit Trek: Which Nepal Adventure Is Right for You?

November 6, 2026 By GISuser

Almost everyone planning a Nepal trip runs into the same wall. You want the big mountains, you have a fixed number of days, and every itinerary you read seems to promise something … [Read More...]

SFL Missions Inc. Confirms Successful Deployment of Six HawkEye 360 Radio Frequency Detection Satellites with Advanced Capabilities

October 27, 2026 By GISuser

MĀHIA, New Zealand, 26 October 2026 – SFL Missions Inc. today confirmed the successful deployment of six radio frequency (RF) detection and geolocation satellites for HawkEye 360 … [Read More...]

Canadian-Built RoadEng 12 Uses AI to Find the Best Location for New Resource and Rural Roads

October 17, 2026 By GISuser

Vancouver, BC, Canada, October 15, 2026 – North Vancouver-based Softree Technical Systems today released RoadEng Version 12, used in more than 75 countries to locate and design … [Read More...]

Beyond the Map: How AI Image and Video Generation Is Changing Geospatial Communication

October 14, 2026 By GISuser

Ask anyone who has shipped a GIS project what the hardest part was, and the answer is rarely the spatial analysis. It is almost always the communication. A site suitability … [Read More...]

From Maternity to Everyday Wear: Building a Wardrobe That Grows With You

October 14, 2026 By GISuser

When I think about maternity clothing, I feel the biggest mistake is buying too many things at once. During pregnancy, your body keeps changing, and something that fits well today … [Read More...]

Copyright gletham Communications 2015 - 2026

Go to mobile version