An eye-catching example of OWDI success is the USGS interactive California Drought Visualization website, released in December 2014.
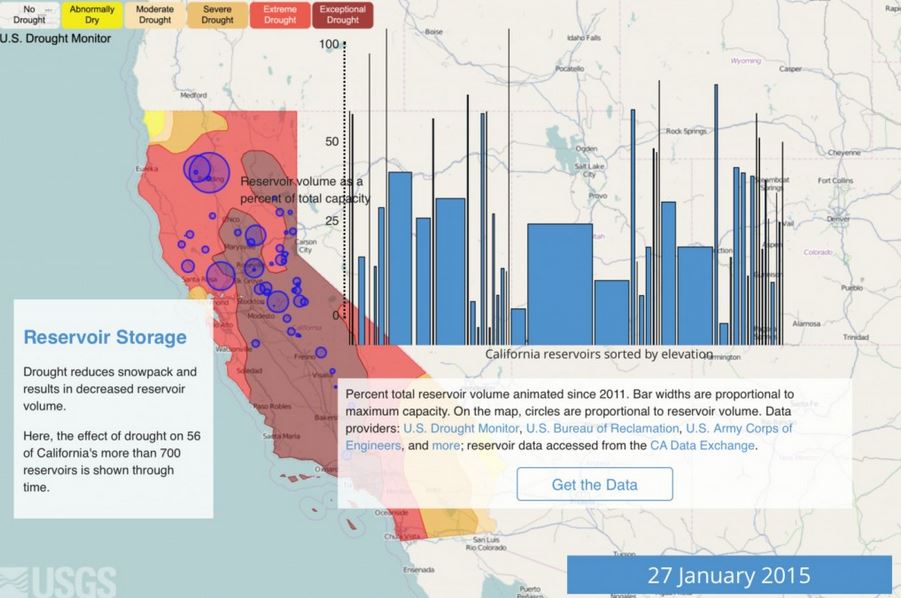
A sample screen from the California Drought Visualization website. Click on the image to go to the website and track both historical and current conditions
This visualization tool is designed to provide the public with atlas-like, statewide coverage of the drought and a timeline of its impacts on water resources. In partnership with the Bureau of Reclamation, options are being explored to expand the visualization to describe conditions across the lower Colorado River region.
The application accesses data from a variety of sources to create a useful “toolbox” for key stakeholders to use when making tough choices about water use, presenting them with valuable water data arranged in a storyline that conveys the complexity of Western water management in a more understandable and interactive format.
Two additional OWDI examples that are transitioning from concept to action are the National Flood Interoperability Experiment and a water quality incident response tool to address situations such as the 2014 Elk River chemical spill near Charleston, West Virginia.
While these examples illustrate how the data can be applied, the focus of the OWDI is not so much on specific applications but on the data behind them. The goal of the initiative is to make all water data from a wide variety of sources discoverable and readily accessible via web interfaces.
The anticipated outcome of the improved availability of real-time data is the distributed development of more complex automated data processing — for instance, models that automatically ingest updated data streams to produce modeled results in real time. A public “marketplace” is also envisioned where innovators inside and outside government can feature open source tools that are based on data liberated through the initiative.
Learn more
