Much talk lately in the tech world is related to Big Data and how useful it really is. The debate centers not only around making relationships, but how to determine which relationships are significant. How do we make all the demographic data we’ve gathered meaningful?
Mapping the Cause: Photo Credit: lib.stanford.edu
A simple way is to utilize the database capability of a GIS to establish relationships, but this often does not happen for a variety of reasons. GIS is often seen as “maps” or a visual graphics product, and the more advanced capabilities are ignored because they remain unknown to key departments and decision makers.
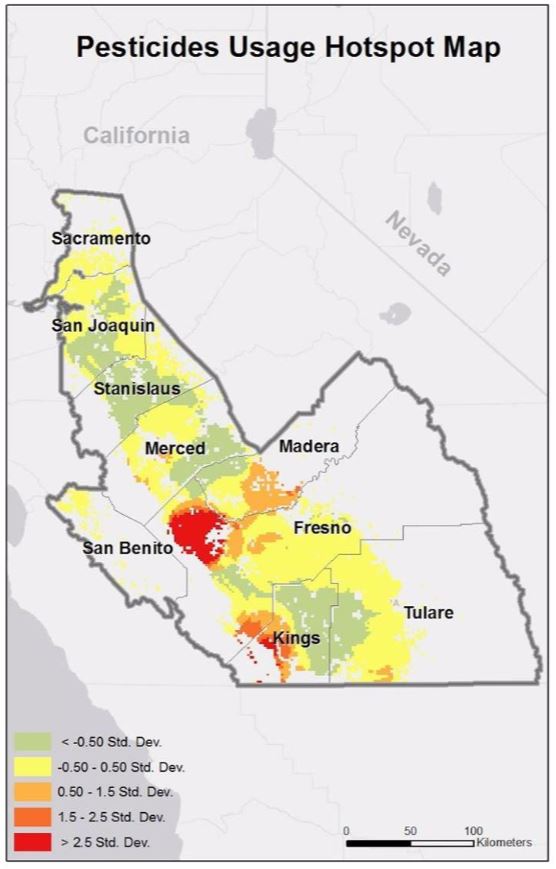
In the healthcare field this has been especially true. But one study, conducted by Carrie Tayour, MPH , Toxics Epidemiology Program, Los Angeles County Department of Public Health and Myles Cockburn, PhD , Department of Preventive Medicine, University of Southern California used GIS to map historical pesticide use, lifetime residential and occupational history with the California Pesticide Usage Reporting System data and land usage data to track exposure to certain pesticides.
The study, titled A GIS-Based Model of Historical Pesticide Exposure on the Risk of Breast Cancer, was conducted in California’s Central Valley, an agriculturally rich area. Researchers compared unexposed women with those exposed to pesticides both at work and at home. Those exposed to certain chemicals showed increased risk of breast cancer, while other pesticides seemed to have little or no effect. Those unexposed showed no increased incidence of breast cancer. Younger women aged 55-64 in the study were also found to be at higher risk than those in the study aged 65-74, making researchers believe there might be a factor related to the age at which exposure occurred.
To GIS users, this study interesting for several reasons:
- Most of the data used is readily available in the public domain
- The study was conducted by two separate disciplines, Epidemiology and Preventive Medicine, neither of which is directly GIS related.
- Historical geographic data provided a more comprehensive picture than static data could
This use of GIS data analysis capability is relatively young, but definitely shows promise. Using big data to map potential causes for cancer can aid in prevention, and perhaps someday even assist researchers in moving toward a cure.
Article by Troy Lambert
About the Author:
Troy Lambert is a freelance writer, editor, and non-profit consultant by day, and a suspense thriller author by night. He learned about the power of GIS while working as a researcher at a museum, and is always looking for ways to apply this technology and big data in new and innovative ways. Troy is an avid cyclist, skier, and hiker. He lives, works, and plays in Boise, Idaho. His work can be found at troylambertwrites.com, and you can connect with him on Twitter @tlambertwrites.